
Stocks are off, and we don’t usually pay attention, but we’d like to visit the casino today and sample a bit of the chatter.
Let’s see,
- US stocks lower as Euro concerns cause investors to shed risk.
- US stocks down on earnings outlook
- US stocks fall, led by energy and crude drops. Dow off 144.
- Stocks fall on weakness in the euro currency.
Lower energy prices cause stocks to fall across the board? Not likely. Both consumer demand and producer costs should be lower with lower energy. Only the oil companies themselves should be worried. And why, with the dangers of new restrictions on offshore drilling, would crude drop? Unless its price were not related to supply and demand in the way that has been advertised. And note for our benefit that the price has been dropping steadily since the Gulf oil spill disaster, as we predicted
Stocks down on earnings outlook. Here is the well-known secret, that earnings are not from revenues, but from cost-cutting. Unfortunately a company’s cut in costs is a worker’s cut in jobs.
And at the top US stocks lower as Euro concerns cause investors to shed risk. We’ll go there later. But let’s see here where the affected European bonds – Greece, Portugal, etc., are today.
Well, the first thing we notice is that European markets are up with the fall in the euro. What about bonds?
Here, volatility indexes, VIX’s are up around the world. Notably India and China and Asia. But what is a Portuguese bond selling for today? Okay, Portuguese two-year notes fell … Fell? they should be rising with the central bank purchases … to 2.97 percent. Hmm. 2.97 does not sound like a number that reflects too much risk.
Greek two-year notes are 7.65. That’s down.
Enough.
As we’ll touch on later. There is a demand problem in the markets. It is not a demand for money. It is money’s demand for someplace to go. The wall of liquidity…
But let’s go to the horizontal Phillips Curve.
Wait! First let’s look at a comprehensive view of the markets with a look at David Rosenberg’s morning note.
The University of Michigan consumer sentiment index eked out a modest advance in early May, to 73.3 from 72.2. To put this level into proper perspective, it has historically averaged 73.9 in recessions and 90.9 in expansions. In other words, the UofM consumer sentiment index is still in recession terrain. Looks like Main Street is a little at odds with the government estimates on GDP. Then again, strip out the temporary influence of an arithmetic inventory bounce and lagged effects from record doses of government stimulus, and believe it or not, the U.S. economy is still contracting.
What also caught our eye in the UofM report was that the homebuying intentions index sagged to 150 from 154 in April (a four-month low) in a sign of what’s to come once the homebuyer tax credit expires (or maybe Bailout Nation will find a way to extend the subsidy yet again). Auto buying intentions also fell in May, to 133 from 142 in April.
All in, the “expectations” components of the report are pointing towards a squishy-soft 1%-type growth for U.S. consumer spending for the second half of the year. As was the case in 2002, the equity market is not priced for such a growth relapse.
LEADERS FALTERING
Indeed, the ECRI leading index for the week ending May 7 fell 2%, the largest slide since the week of December 5, 2008. The level for the index is now at 132.00 — lowest level in 10 weeks.
The smoothed index continues to slow down, now at 12.2% for the week, a deceleration from the 12.7% pace the prior week and a lot slower than the near 30% pace back in early October 2009. It is now running at a 40-week low.
Just as the coincident indicators are rising (employment, production), the leading indicators are rolling over. Do not drive looking through the rear window — it’s time to take risk and cyclicality off the table.
A REVENUE-LESS RECOVERY?
The CBO just released the April data and it showed that “revenue and other income” was down 7.9% from last year’s depressed level. Hmmm… maybe this is what happens when employment goes up but the wage rate goes down.
DEFLATION IS THE PRIMARY TREND
- Credit is contracting.
- Wage rates are stagnating.
- Money supply growth is vanishing
- The U.S. dollar is strong.
- Commodities have peaked
- U.S. home prices are rolling over … again
- Lumber prices tumbling (down nearly 17% from April 2010 highs)
- Wal-Mart is cutting prices on 10,000 items
- Home Depot just cut prices on flowers, fertilizers, lawn equipment and outdoor furniture
- Taco Bell is offering two dollar combo meals
- The April U.S. retail sales report hinted at deflation in groceries, electronics, apparel and sporting goods.
Thank you, David Rosenberg. It is only fair to note that Rosenberg is now travelling the world as the token bear in the various economic conferences.
Here, from Anatole Kaletsky, speaking at the INET conference in April
KALETSKY
The horizontal Phillips Curve
What does a horizontal Phillips Curve mean? that unemployment has no effect on inflation. This contrary to the NAIRU – non-inflation accelerating rate of unemployment – that is the first commandment of the inflation targeters. That is, another of the fundamental economic principles of the Fed is bogus.
You may recall that one of Ben Bernanke’s first initiatives was the implementation of public forecasts from the governors of the Fed as a stealth way of targeting inflation. This was in the blissful days before the economic event of the generation caught them from the blind side. (Which, I guess, was every side except the inflation side.) And before deflation became the dragon in the room.
You’ve heard us dispute this notion that low unemployment was to be avoided because it would surely cause a spiral of inflation. And it is our view that the nearly perfect correlation between productivity and the unemployment level – productivity rising in proportion and contemporaneously with a drop in unemployment – indicates that there is a built-in bias against inflation with lowering unemployment, because productivity increases are a bias against inflation.
I hope that is clear.
What should also be clear is that the inflation this generation has known has never been related to employment. The only unemployment rates that were low enough to warrant concern on this front existed in the second term of Bill Clinton, the last half of the last decade of the Twentieth Century. No inflation.
What has accompanied consumer and producer inflation is oil price changes. You could draw a line. And we have before. But how about asset price inflation – housing, for example? Here the corresponding and obvious cause is debt.
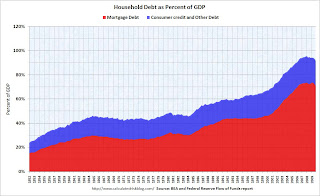
Household debt as a proportion of GDP is down to ONLY 94 percent of GDP, as opposed to 96 percent when the recession began in late 2007. Or substantially below 70 percent in 2000. The great mass of accumulated household debt is mortgage debt, and it was the explosion in mortgage debt that exploded the total household debt.
Housing prices skyrocketed, but inflation remained benign. This is possible because it is not the price of houses that shows up in inflation numbers, but the rental value of houses. Had the actual price of houses been included, inflation would not have been so benign.
But lets reflect on the disconnect between inflation now and inflation then. At one time inflation meant a rise in the general level of prices. Now it means, basically, a rise in the price of oil and some other commodities.
The level of household debt in the U.S. dwarfs the level of government debt. We might squeeze in an idiot of the week with Ken Rogoff of Harvard later in the podcast, because Rogoff and others basically ignore this debt. Most people confused about the causes and conditions and solutions to the current stagnation ignore this debt.
Households in total are at 94 percent. Households in particular, in specific, may be at multiples of this number, with debt far exceeding their annual incomes. They are in the situation of Greece. And the official government response is similar to that in the current European crisis. Yes, lenders lent money to these borrowers to collect the risk premia and get a higher return on their investment. But when the risks actually materialize, it is inconceivable that the lenders should actually renegotiate the debts down. That is what default is. A restructuring of the debt.
Instead the taxpayers and central banks must come up with the cash to make the lenders whole. If they don’t, what happens? The borrowers cannot get more credit.
That’s all.
Some might say that is just putting things on rational ground, preventing the next round of excess risk based on the knowledge that there really is no risk, since the government will bail out the loans.
I want to take a slightly different tack. There is a demand for this capital, but there is also a demand for the bonds and loans. A huge flood of liquidity is sloshing around not finding any productive investment. It is bidding down the price of U.S. government bonds and any other near riskless security.
If we step back and look at the housing boom, we are not so sympathetic to the victims of Goldman Sachs and John Paulson. There was a time when anything with the word “mortgage” in it could be sold in the blind. Shoot, the synthetic CDOs that are one big root of the collapse do not have real mortgages in them, but only refer to mortgages. The demand by people with large amounts of money for these products drove the lending practices that produced the shoddy mortgages. It was not a horde of shakey borrowers at the gate demanding money for the ability to breathe.
It is our view that a good place for this excess liquidity is taxes, funding governments. Greece, for example, has a national tradition of not paying taxes. That is at least as much a cause of their fiscal problems as their profligate spending on teachers.
Raising taxes on the rich would, of course, cause the rich to relocate to tax havens. But it could be done and needs to be done. There is no other beneficiary from the causes of the current calamity. Is it class war? Well, in a representative democracy, it would be an issue of debate. As it is, however, those who need to be made whole in the view of these representative democracies, are the lenders. The borrowers need to accept their role as flotsam in the capitalist system.
Household Debt as a Percent of GDP
by CalculatedRisk on 4/13/2010 07:37:00 PM
From Neil Irwin at the WaPo: Economic data don't point to boom times just yet
"There have always been Wall Street economists wanting to cheerlead the recovery, and quick to jump on any piece of news showing a great boom is around the corner," said Kenneth Rogoff, a Harvard economist. "The data so far are more consistent with a very moderate recovery."
There are a number of reasons that would be the case. American households are trying to reduce debt to stabilize finances. But they are doing so slowly, with total household debt at 94 percent of gross domestic product in the fourth quarter down just slightly from 96 percent when the recession began in late 2007.
...
"When you have a recession that's amplified by a deep financial crisis, the recovery is slower and more painful, much akin to recovering from a heart attack," said Rogoff ... "It just takes time. If you look at a typical recovery, we would be growing at 7 or 8 percent by now given the depth of our fall."
 Click on graph for larger image.
 This graph, based on the Federal Reserve Flow of Funds data, shows household debt as a percent of GDP through Q4 2009 (note: I removed a few non-profit categories).
Note that the household debt problem is mostly a mortgage debt problem. Mortgage debt as a percent of GDP started really picking up in 2001 and 2002 and continued to increase sharply through 2006.
There was also a sharp increase in mortgage debt in the late '80s. That was partially associated with Tax Reform Act of 1986 that only allowed mortgage debt to be tax deductible, and excluded interest on all personal loans including credit card debt. There was also a smaller housing bubble in the late '80s that was associated with the increase in mortgage debt.
 The second graph shows the annual change in the percent of household mortgage debt.
 There was some increase in the late '90s associated with the booming economy and stock bubble wealth effect. But the real boom in mortgage debt started in the 2nd half of 2001 - and continued through 2006. This rapid increase in mortgage debt should have been a red flag for regulators.
Finally, on Rogoff's comment about "Wall Street economists wanting to cheerlead the recovery", there is an old saying on Wall Street for analysts: Bearish equals unemployed. Of course they are cheerleading!
http://www.calculatedriskblog.com/2010/04/household-debt-as-percent-of-gdp.html?utm_source=feedburner&utm_medium=feed&utm_campaign=Feed%3A+CalculatedRisk+%28Calculated+Risk%29


No comments:
Post a Comment