
We're on the road and we left our sound effects at home, so we'll let this go through without interruption. But be clear, we have our issue with Achuthan.
Listen to this episode
And just to set the scene, in the months after the 2007 recession began, ECRI and Achuthan insisted it had not begun and was not likely. We picked apart the analysis then to figure out why they were so divergent from our view. Turns out the elements of the leading indicators were heavy with financial markets and monetary indicators such as interest rates. These are exactly the targets of the Fed and Treasury. So these indicators were in the green zone. Turns out that manipulating the dial does not fix the engine. Fixing the engine will give you the readings on the dial you want, but jimmying the readings does nto fix the engine.
So the self-congratulation you may hear from Achutan for this call might have been qualified with a memory of 2008, but they were not.
Similarly, when we go over the indicators of employment, sales, output, and so on. These are indicators of the business cycle. They are not the business cycle, which if it means anything must mean the cycle of business investment. When investment is moribund, as we've said, it's hard to see a business cycle. In fact, the business cycle is broken. All the effort to jinn up investment with cheap money and tax breaks has been more expensive than effective.
Consequently we have said that the last recession never ended.
As to the impossibility of predicting the onset of recession, Steve Keen did it, we did it, Nouriel Roubini did it. It's not a matter of shocks hitting you in the back of the head, it's a matter of demand being systematically undermined. We've done it twice, having predicted the downturn of 2000. What we haven't done, I guess, that excludes us from the ranks of legitimate forecasters, is predict recovery. Or in the current case, even accept a recovery.
After 2001, with the so-called jobless recovery, we called foul, saying a jobless recovery is not a recovery. Now, as we repeat, we say we are not in recovery, but bouncing along the bottom. Financial markets recovered, but what else? Corporate profits. Granted. Bank balance sheets. But wither investment.? Okay, Okay. Here is Achuthan.
That was December. Achuthan is right. Economists DO focus on short-term data. You saw that again this month. Economists vied for decimal points in forecasting the second quarter. Second quarter. That is over. Forecasting the past. Important, it seems, for some purposes, but helpful ... not so much.
Let's stop and let the guy talk.
LONG
Laksman Achuthan courtesy of Bloomberg Surveillance.
But please. Yo-yo years? This is stagnation. It's becoming a new normal, an accepted dissolution of a society. Lost jobs, low incomes. Yes it's globalized and abetted by trade imbalances, but it's not inevitable.
From Econ Intersect we excerpt these notes:
The advance estimate of first quarter 2012 Real Gross Domestic Product (GDP) is 1.5%
- 3Q2011 GDP was revised down from 1.8% to 1.3%, 4Q2011 GDP was revised up from 3.0% to 4.1%, and 1Q2012 GDP was revised up from 1.9% to 2.0%
- The market expected the advance estimate 2Q2012 GDP from 0.3% to 1.2%.
...
Real GDP is inflation adjusted and annualized – the economy only grew moderately per capita, and per capita GDP is roughly slightly more than half recovered from the trough of the great recession.
Real GDP per Capita

BEA says:
The increase in real GDP in the second quarter primarily reflected positive contributions from personal consumption expenditures (PCE), exports, nonresidential fixed investment, private inventory investment, and residential fixed investment that were partly offset by a negative contribution from state and local government spending. Imports, which are a subtraction in the calculation of GDP, increased.
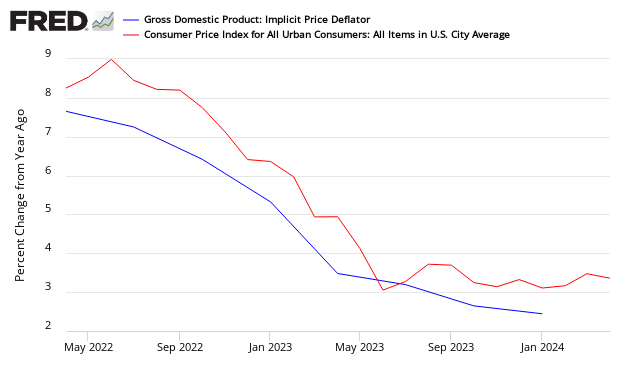
The deceleration in real GDP in the second quarter primarily reflected a deceleration in PCE, an acceleration in imports, and decelerations in residential fixed investment and in nonresidential fixed investment that were partly offset by an upturn in private inventory investment, a smaller decrease in federal government spending, and an acceleration in exports.Inflation continues to moderate as the “deflator” which adjusts the current value GDP to a “real” comparable value continues to moderate. The following compares the GDP deflator to the Consumer Price Index:
This release included significant backward revision caused by the regular annual revision.
The estimates released today reflect the regular annual revision of the national income and product accounts (NIPAs), beginning with the estimates for the first quarter of 2009. Annual revisions, which are usually released in July, incorporate source data that are more complete, more detailed, and otherwise more reliable than those previously available. This release includes the revised quarterly estimates of GDP, corporate profits, and personal income and provides an overview of the effects of the revision.

The backward revision was so large, one wonders why we even react to GDP releases in real time.
The chart below is a way to visualize real GDP change since 2007. The chart uses a stacked column chart to segment the four major components of GDP with a dashed line overlay to show the sum of the four, which is real GDP itself. As the analysis clear shows, personal consumption is key factor in GDP mathematics.

Caveats on the Use of Gross Domestic Product (GDP)
GDP is market value of all final goods and services produced within the USA where money is used in the transaction – and it is expressed as an annualized number. GDP = private consumption + gross investment + government spending + (exports − imports), or GDP = C + I + G + (X – M). GDP counts monetary expenditures. It is designed to count value added so that goods are not counted over and over as they move through the manufacture – wholesale – retail chain.The vernacular relating to the different GDP releases:
“Advance” estimates, based on source data that are incomplete or subject to further revision by the source agency, are released near the end of the first month after the end of the quarter; as more detailed and more comprehensive data become available, “second” and “third” estimates are released near the end of the second and third months, respectively. The “latest” estimates reflect the results of both annual and comprehensive revisions.Consider that GDP includes the costs of suing your neighbor or McDonald’s for hot coffee spilled in your crotch, plastic surgery or cancer treatment, buying a new aircraft carrier for the military, or even the replacement of your house if it burns down – yet little of these activities is real economic growth.
GDP does not include include home costs (other than the new home purchase price even though mortgaged up the kazoo), interest rates, bank charges, or the money spent buying anything used.
It does not measure wealth, disposable income, or employment.
In short, GDP does not measure the change of the economic environment for Joe Sixpack in 1970, and Joe Sixpack’s kid in 2011, yet pundits continuously compare GDP across time periods.
Although there always will be some correlation between all economic pulse points, GDP does not measure the economic elements that directly impact the quality of life of its citizens.


No comments:
Post a Comment